
The insight and analysis provided by the needs assessment helps to inform the direction and policy decisions of the VRU and partners and is critical to the success of the VRU.
Interactive Web-Based Strategic Needs Assessment
We have also developed a dynamic, web-based version of the SNA which allows people to select specific areas of interest and discover data and information on violence, crime and risk in the West Midlands in an intuitive, interactive way. There is also information on schools and the place-based pilots, including links to ‘place-based story maps’ that show the data in an engaging way, alongside the views and voices of the residents, and describe the work of the VRU and its network of partners in those places in more detail.
We have also produced Strategic Needs Assessments for the seven local authorities, which can be found below
Some key extracts of the 2021 assessment are below:
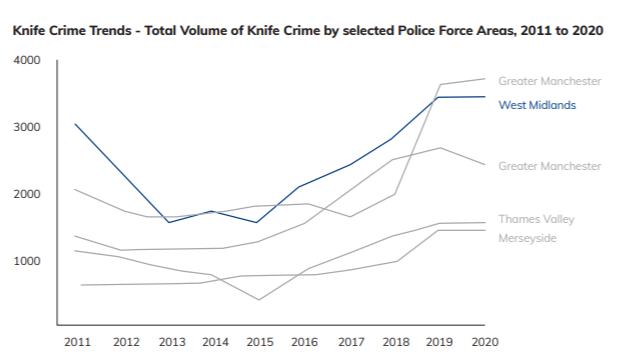
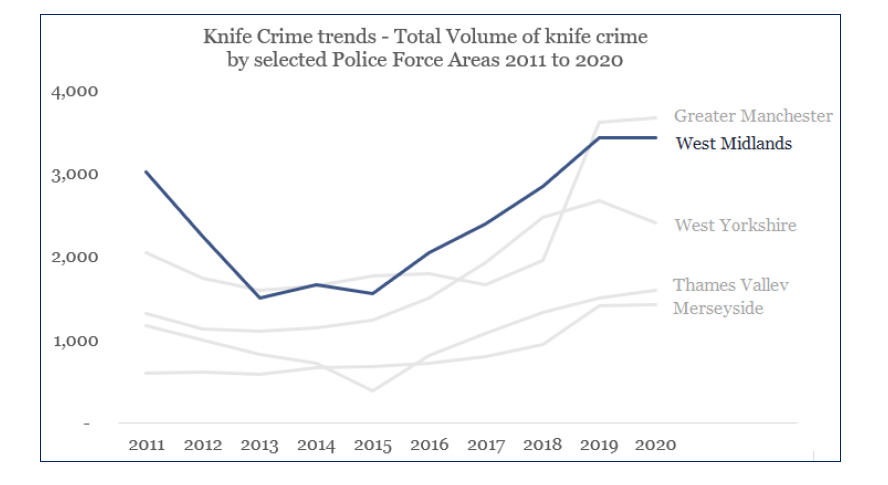
Knife Crime (Page 11)
- The top five police force areas (excluding London) have seen a rise in knife crime since 2015, but with some clear differences in the patterns and rate of increase
- In the West Midlands, this steep rise after 2015 followed a dramatic fall from 2011
- Most recently, there is some indication of a slowing down, which may be due to the impact of the lockdowns and Covid-19 pandemic
- A change in crime reporting practices within Greater Manchester Police may explain the significant increase in 2018.
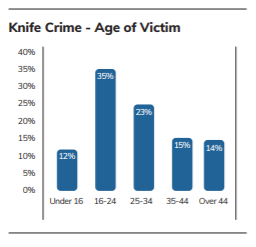
Knife crime – age of victim (page 14)
- A third of victims of reported Knife crime in the West Midlands are aged between 16 and 24. More than two thirds are under 34 years old.
- 12% of victims of knife crime – approximately one in eight of all victims – are under the age of 16
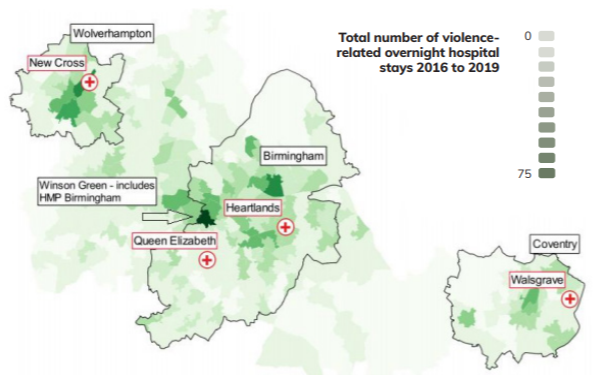
Hospital Episode Statistics map (page 19)
- The dark green neighbourhood of Winson Green, in west Birmingham includes the prison, HMP Birmingham, which accounts for a large proportion of hospital admissions from that area
- Other notable hotspots include swathes of inner-city Birmingham neighbourhoods including Gravelly Hill & Erdington (just north of Heartlands hospital); Smethwick in Sandwell (west of Birmingham); Heath Town in Wolverhampton and Foleshill in Coventry
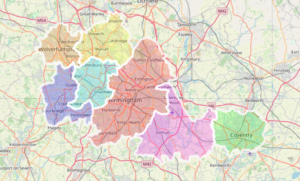
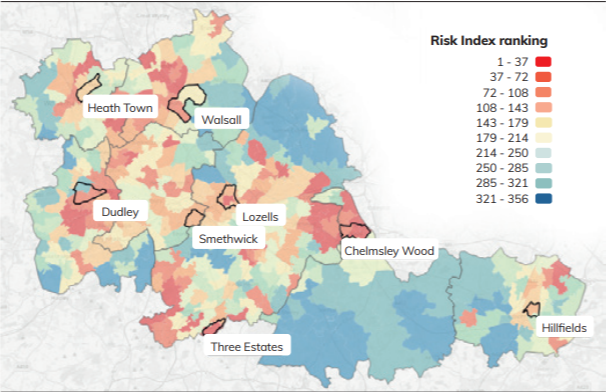
Risk index (page 33)
The map below shows the 356 neighbourhoods in the risk index colour-coded according to their position in the table. The top 10% of neighbourhoods with the highest risk index ranking are shaded red. The lowest risk neighbourhoods (321 to 356) are shaded blue. The West Midlands VRU Place-Based pilot areas for 20/21 are also labelled on the map with black outlines.
- All the VRU Place-Based pilot areas are in neighbourhoods with very high or high risk, but it is clear that there are also other neighbourhoods with high risk
- Some of these – such as Blakenall and Bloxwich (Walsall), Henley and Wood End (Coventry), central Dudley and parts of south and east Birmingham, are strongly suggested as future areas for the VRU and partners to explore.
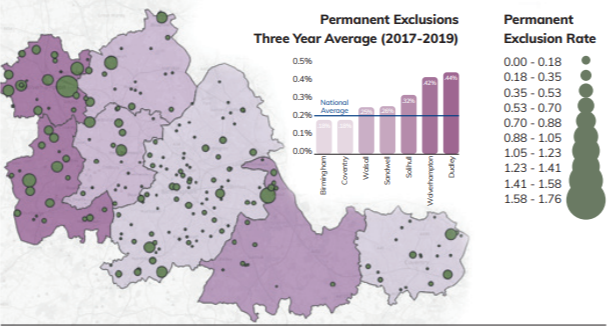
School exclusions in the West Midlands (page 35)
- At a regional level, permanent school exclusion rates for the period 2017-19 in the West Midlands were higher than the national average in the West Midlands. They have been rising steadily since 2012.
- For the same period, the rate of permanent exclusions within Birmingham and Coventry were just under the national average at 0.18%.
- There are areas of concentrated complexity: 80% of permanent exclusions within the West Midlands were generated by 12% of all schools in the West Midlands.
Assess and Refine
The latest version of the needs assessment was published in April 2021. It is not a finished piece of analysis, nor will it ever be. The VRU analytical team are always seeking to improve, update and refine the data and evidence base. Please get in touch if you have any questions, comments, suggestions, or ideas.